Published: Nov 11, 2026 · 9 min read
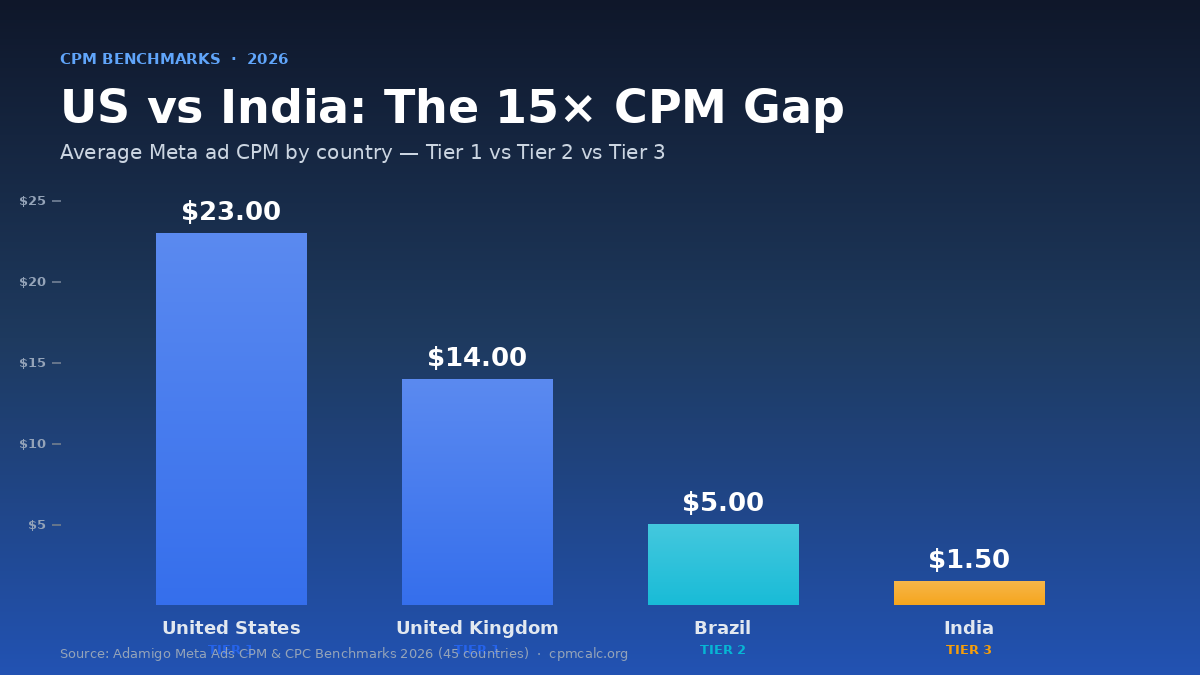
Table of Contents
The average Meta advertising CPM in the United States is $23.00. In India, it is $1.50. That is a 15.3× difference for what is, on paper, the same ad impression — a 1,000-view unit of inventory on the same platform, served through the same auction, measured by the same metric.
This gap is not a pricing error or a platform bug. It is the cumulative output of five separate economic forces that interact in predictable ways across every advertising market on Earth. Understanding those forces is the difference between treating geo-targeting as a line item and treating it as a profit lever.
If you allocate ad budget across countries, this breakdown tells you exactly why the US costs what it costs, why India costs what it costs, and — more importantly — when a $1.50 CPM is actually more expensive than a $23 CPM.
The 15× Gap: What the Data Shows
The CPM differential between countries is not gradual. It clusters into three distinct tiers, and the jump between tiers is roughly an order of magnitude.
| Country | Tier | Avg CPM | CPM Range | Avg CPC | vs US |
|---|---|---|---|---|---|
| United States | 1 | $23.00 | $18 – $28 | $2.69 | 1.0× |
| Australia | 1 | $18.50 | $15 – $22 | $2.10 | 0.80× |
| United Kingdom | 1 | $14.00 | $11 – $17 | $1.85 | 0.61× |
| Canada | 1 | $13.40 | $10 – $16 | $1.75 | 0.58× |
| UAE | 2 | $6.00 | $4 – $8 | $0.85 | 0.26× |
| Brazil | 2 | $5.00 | $3 – $7 | $0.70 | 0.22× |
| Mexico | 2 | $4.50 | $3 – $6 | $0.65 | 0.20× |
| Thailand | 2 | $3.50 | $2 – $5 | $0.55 | 0.15× |
| India | 3 | $1.50 | $0.80 – $2.50 | $0.20 | 0.065× |
| Nigeria | 3 | $0.80 | $0.50 – $1.20 | $0.10 | 0.035× |
The United States sits at the top of Tier 1 at $23.00, while India anchors Tier 3 at $1.50. The ratio between them is 15.3:1. Even within tiers the spread is wide — US to UK is 1.6×, US to Brazil is 4.6×, US to Nigeria is 28.8×. These are not edge cases; they are averaged, aggregated CPM across all ad objectives on Meta platforms for Q3 2026.
You can verify every figure on our average CPM by country benchmark page, and model your own campaign costs with the Facebook Ads CPM Calculator.
Five Economic Forces Behind the Gap
The 15× US-to-India CPM ratio is the product of five forces that each push in the same direction. None of them alone explains the gap; all of them together do.
Purchasing Power and GDP per Capita
Advertisers bid based on what a customer is worth to them. A US consumer's average order value and lifetime value are roughly 30× an Indian consumer's, so advertisers can profitably pay 15× more per impression and still hit their ROAS targets. CPM tracks purchasing power, but not 1:1 — competition and conversion rates absorb part of the gap.
Advertiser Competition Density
The US has roughly 11 million active advertisers on Meta platforms. India has roughly 1.5 million. More advertisers bidding on the same auction inventory drives CPM up. The US ad market is saturated with enterprise brands, DTC companies, and agencies all competing for finite impression inventory. India's auction is less dense, so the same impression clears at a lower price.
This is why CPM in the UAE ($6.00) is higher than in Brazil ($5.00) despite Brazil having a larger population — the UAE has higher advertiser density per available impression due to its concentration of luxury, finance, and B2B advertisers competing for a relatively small user base.
Conversion Rates and Customer LTV
A $23 CPM is only expensive if your conversion rate is low. US e-commerce conversion rates average 2.5–3.0% per click, according to WordStream's industry benchmarks. Indian e-commerce conversion rates typically run 40–70% lower than US equivalents due to lower trust in online payment, higher cash-on-delivery preference, and less mature checkout infrastructure. The CPA math is worked out in the ROAS Equalizer section below — but the short version is that conversion rate differences offset a large portion of the CPM advantage.
Digital Ad Market Maturity
Tier 1 markets have 15+ years of mature programmatic infrastructure, sophisticated attribution tooling, and advertiser education. This maturity means more budgets are deployed efficiently, more lookalike modeling is used, and more retargeting layers compete for the same impressions — all of which push CPM up. Tier 3 markets are still building this infrastructure, so a larger share of impressions clears at floor pricing.
Japan is an instructive outlier: it has Tier 1 GDP but a partially independent domestic ad ecosystem (heavy Yahoo Japan and LINE usage), which insulates its CPM from global platform trends more than other Tier 1 markets.
Currency Valuation and Exchange Rates
CPM is reported in USD, but advertiser budgets and consumer spending are in local currency. When the Indian rupee weakens against the dollar, Indian advertisers' effective bidding power in the USD-denominated auction drops, which pushes CPM down further in dollar terms. The reverse happens in Tier 1 markets with strong currencies. This currency effect accounts for roughly 5–10% of the observed CPM differential and fluctuates with FX movements.
The ROAS Equalizer: Why Cheap CPM ≠ Cheap Results
Here is the part most media buyers get wrong: a 15× lower CPM does not produce a 15× lower cost per acquisition. Conversion rates and customer lifetime value differ by geography too, and they erode the Tier 3 advantage — sometimes completely.
The relationship between CPM and CPA is:
Where CTR is click-through rate and CVR is conversion rate per click. Plug in the numbers for a typical e-commerce campaign:
| Metric | United States | India | Ratio |
|---|---|---|---|
| CPM | $23.00 | $1.50 | 15.3× |
| CTR (assumed) | 1.0% | 0.9% | 1.1× |
| CVR per click | 2.8% | 1.2% | 2.3× |
| CPA | $82.14 | $13.89 | 5.9× |
| Avg order value | $120 | $18 | 6.7× |
| ROAS | 1.46× | 1.30× | — |
This is why blindly shifting budget to Tier 3 markets based on CPM alone destroys ROAS. The CPM gap is real, but it is partially a measurement artifact of different purchasing power — and purchasing power is also what determines how much a converted customer is worth to you.
When Tier 3 Markets Actually Win
The ROAS equalizer does not mean Tier 3 markets are never worth it. It means the decision depends on your campaign goal. Tier 3 wins decisively in three specific scenarios:
1. Brand Awareness and Reach Campaigns
If your KPI is impressions, reach, or ad recall — not conversions — then CPM is the only metric that matters. A $1.50 CPM delivers 15× more impressions per dollar than a $23 CPM. For a brand launching in Asia with a fixed awareness budget, India, Indonesia, and the Philippines are unambiguously the right buy. Use the Batch CPM Calculator to compare reach across geos side by side.
2. Mobile App Install Campaigns (Tier-Independent LTV)
If your app has a global LTV model (e.g., a free utility app monetized by AdMob where a user in India generates similar ad revenue to a user in the US), then CPA is the right metric and Tier 3's lower CPA wins outright. Mobile install campaigns consistently see 3–5× lower CPI in India vs the US.
3. Gen Z Audience Targeting
India and Indonesia have the world's largest Gen Z populations. If your product skews under-25 and audience composition matters more than per-user revenue, Tier 3 delivers the audience at a fraction of the cost. TikTok is particularly efficient here — see the TikTok CPM Calculator for niche-specific estimates.
When Tier 1 Markets Are Worth the Premium
Conversely, the $23 CPM is the correct buy when customer value is geography-dependent and concentrated in high-income markets:
1. High-LTV SaaS and Subscription
A SaaS customer in the US paying $99/month for 24 months has an LTV of $2,376. The same product in India may churn after 3 months at a localized price of $5/month (LTV $15). The 158× LTV ratio dwarfs the 15× CPM ratio — Tier 1 is the only profitable buy. Calculate your break-even with the ad ROI and ROAS guide.
2. Financial Services and Insurance
Finance is the highest-CPM niche on every platform because a single converted customer is worth thousands of dollars. A US mortgage lead is worth $200–$500; an Indian mortgage lead is worth $5–$15. The CPM premium is justified by the LTV premium. This is why finance CPM benchmarks show $15–$50 YouTube CPMs — advertisers can afford it.
3. Local and In-Person Services
If you run a dental clinic in Chicago, advertising in India is literally worthless — your customers must be within driving distance. Geo-targeting here is non-negotiable, and the CPM is whatever the local market charges. The relevant comparison is CPM by US metro, not CPM by country.
Blended Geo Strategy: Real Campaign Math
Most sophisticated media buyers do not choose Tier 1 OR Tier 3 — they run a blended portfolio that hedges CPM against ROAS. Here is the math on a $10,000 monthly budget split 70/30 between US and India:
| Geo | Budget | CPM | Impressions | Est. CPA | Est. Acquisitions |
|---|---|---|---|---|---|
| US (70%) | $7,000 | $23.00 | 304,348 | $82.14 | 85 |
| India (30%) | $3,000 | $1.50 | 2,000,000 | $13.89 | 216 |
| Blended | $10,000 | $4.36 | 2,304,348 | $33.22 | 301 |
The blended strategy delivers a $4.36 effective CPM — 81% lower than US-only — while generating 3.5× more acquisitions than US-only (301 vs 85). The trade-off is that the 216 Indian acquisitions carry lower per-user value. Whether this is a good trade depends entirely on your LTV differential, which is why understanding CPM vs CPC at the portfolio level matters more than optimizing either metric in isolation.
How to Check CPM for Your Target Country
Before you commit a budget to a new geography, verify the current CPM. Benchmarks drift 15–25% per quarter, and the figures in this article are Q3 2026 snapshots.
- Average CPM by Country — full table of 30+ countries across all three tiers, updated quarterly.
- Facebook Ads CPM Calculator — model your Meta campaign costs against country benchmarks.
- Instagram CPM Calculator — Instagram CPM now exceeds Facebook in several Tier 1 markets; check before assuming Meta is homogeneous.
- TikTok CPM Calculator — TikTok CPM runs 30–50% below Meta in most geos; useful for Tier 3 reach.
- CPM to CPC Converter — translate a country's CPM into CPC using your CTR, since CPC is the metric that actually predicts acquisition cost.
One more consideration: Q4 seasonal CPM spikes affect Tier 1 markets most severely (US CPM can hit $28+ in November). If you are planning a Tier 3 expansion, Q4 is actually the best time to test — Tier 3 CPMs are far less seasonal.
Conclusion
The 15× CPM gap between the US and India is not arbitrary. It is the equilibrium price of five economic forces: purchasing power, advertiser density, conversion rates, market maturity, and currency valuation. Each force pushes CPM in the same direction, and together they produce the tier structure that defines global ad pricing.
The practical takeaway is not "Tier 3 is cheaper, buy Tier 3" or "Tier 1 is expensive, avoid Tier 1." It is that CPM is a denominator, not a verdict. The right geo mix depends on what a converted customer is worth to you in each market, and that LTV differential is the single number that determines whether a $1.50 CPM is a bargain or a trap.
Run the blended math, check the live benchmarks, and let ROAS — not CPM — decide your geo allocation.
Data Sources & References
The benchmark data and statistics on this page are sourced from the following industry reports and publications. All figures reflect the most recent available data as of Q3–Q4 2026.
| Source | Data Provided | Published |
|---|---|---|
| Adamigo — Meta Ads CPM & CPC Benchmarks 2026 | Country-level CPM and CPC across 45 countries (Facebook + Instagram) | 2026 |
| SuperAds — Facebook CPM Data | Facebook CPM trends 2025–2026, cross-check for Adamigo figures | 2025–2026 |
| WordStream — Google Ads Benchmarks | US conversion rate by industry (e-commerce 2.5–3.0%), CPC benchmarks | 2025–2026 |
| Sprout Social — Social Media Statistics | Advertiser count by market, regional engagement and conversion differentials | 2026 |
| World Bank — GDP per Capita | GDP per capita (current US$) for all referenced countries | 2025 |
| Business of Apps — CPM Data | Platform-level CPM methodology, currency impact on CPM | 2025 |
| AdManage — TikTok Ads Cost | TikTok CPM by geo (referenced for Tier 3 reach comparisons) | 2026 |
| Digital Applied — YouTube Statistics 2026 | YouTube CPM by geo and niche (cross-platform context) | 2026 |
Last updated: November 2026. We review and update country CPM data quarterly to reflect the latest industry trends. Seasonal variation of 15–25% should be expected, particularly during Q4 holiday periods — see our Q4 CPM seasonality guide for details.